Search
Getting Started
Feature guides
External Data Sources
Dreambase Plugin & MCP
Community support
Ways to combine Dreambase MCP tools with Dreambase Skills — health reports, custom dashboards, data journals, public reports, and agentic workflows.
The Dreambase MCP server gives any AI agent live, authenticated access to your workspace — dashboards, prepared datasets, metric snapshots, and Supabase health reports. On its own that's a data pipe. Combined with the Dreambase Skills and whatever else your agent can reach, it becomes a way to go from your warehouse to a finished artifact in a single prompt.
Dreambase MCP tools
Every tool is scoped to a workspace, so list_workspaces is usually the first call an agent makes.
Discovery —
list_workspaces,whoami,list_dashboards.Datasets —
list_datasetsandget_datasetreturn handles: name, full column schema, row count, owning dashboard.query_datasetruns one read-only DuckDBSELECTover a single dataset, which is queryable as the tabledataset.Aggregates —
list_aggregatesandget_aggregatereturn metric snapshots: daily-resolution values per metric, week-over-week change with direction and magnitude, and the narrative insight attached to each. This is the fast path for KPIs.Supabase health —
create_health_reportkicks off an analysis of a connected Supabase project;get_health_reportpolls for it and returns metrics, scores, a grade, insights, and recommendations.list_health_reportsgives you the history.
Dreambase Skills
/dreambase-visualization-design decides each chart. /dreambase-echarts builds and validates it. /dreambase-data-stories shapes the artifact around it. /dreambase-public-reports makes it safe to publish. /dreambase-industrial-schematics handles technical illustration.
Everything else your agent can reach
The MCP is one connector among many. The combinations get interesting when Dreambase data meets your codebase, your Supabase project, your Slack, your Linear, or your design tools in the same session.
Why this saves tokens
Worth stating plainly, because it changes what's practical.
The usual agentic analytics loop is expensive: connect to a database, introspect the schema, write exploratory queries, page through raw rows, and re-derive the same aggregates on every single run. You pay for all of it in context, every time.
Use cases
1. Supabase health reports on demand
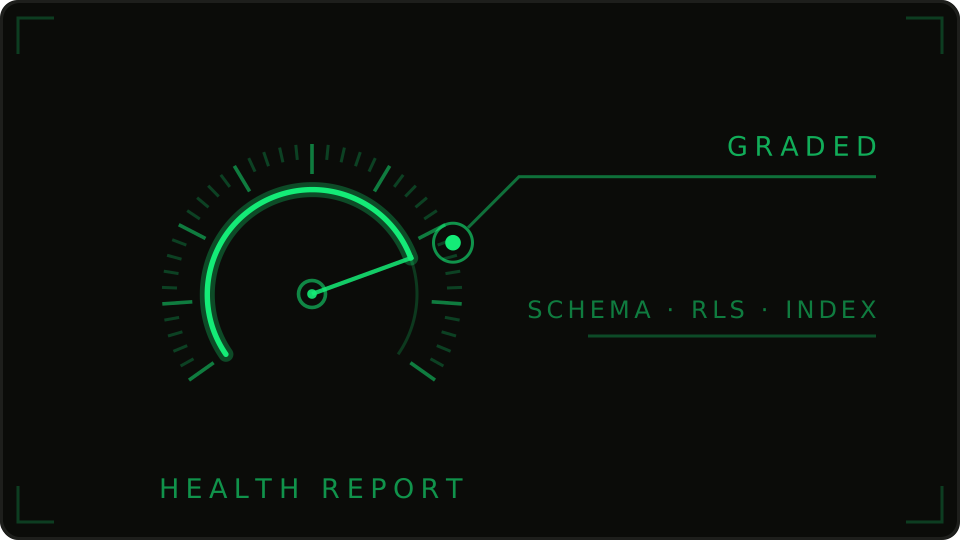
Ask for a health report in plain language and get a graded assessment of a connected Supabase project back — schema, indexes, security posture, performance signals, and specific recommendations.
The agent starts the report, polls until it completes, and summarizes what matters. Where it gets genuinely useful is the follow-up, because the agent can act on what it found:
Add
/dreambase-data-storiesto turn a raw report into a reviewable one-pager for your team.Pair it with a Supabase or GitHub connector and ask the agent to open a migration for the missing indexes it identified.
Run it against every connected project and ask for a comparison — which environment is drifting, and in what direction.
Track grades over time with
list_health_reports, and chart the trend with/dreambase-echarts.
Prompt
Use @Dreambase mcp and create a Supabase health report using /dreambase-echarts with /dreambase-visualization-design best practices strictly following /dreambase-data-stories to create an infographic to tell the story of our database health
2. Custom sales and revenue dashboards
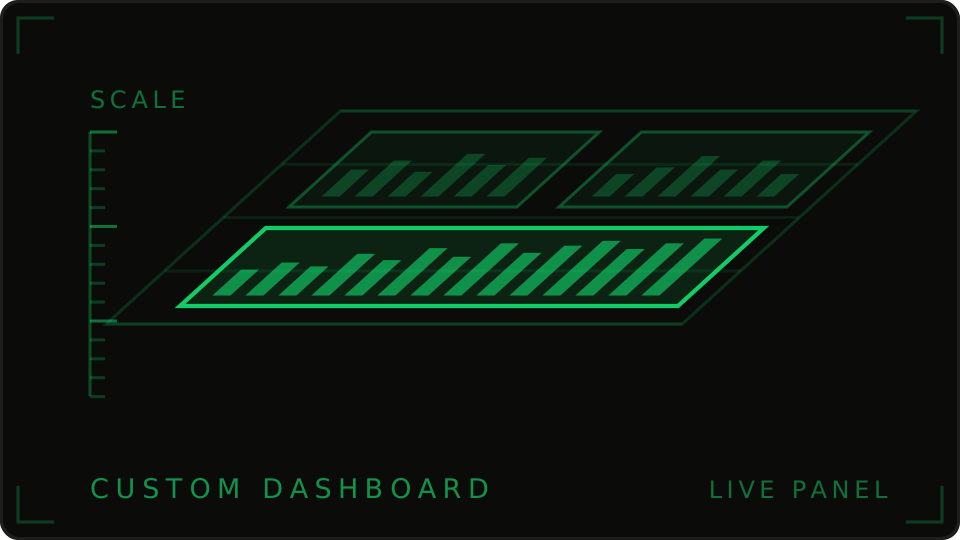
Your sales data usually lives in several places at once — Postgres, Stripe, HubSpot, Salesforce. Dreambase has already unified and prepared it, so the agent starts from joined data rather than assembling it live.
The agent lists the relevant datasets, inspects their schemas, aggregates in SQL, then builds validated chart configs. Bring in /dreambase-visualization-design and it will argue with you about the encoding first — pipeline stages become a funnel, cohort retention becomes small multiples rather than a dozen overlapping lines, and a target gets a bullet graph instead of a lonely traffic light.
Variations worth trying: a weekly pipeline review that regenerates itself, a rep leaderboard with honest sorting and denominators, a segment-level ARR breakdown, or forecast-versus-actual with the uncertainty actually drawn in.
Prompt
Use @Dreambase mcp to pull our sales datasets and pre-calculated aggregates, then build a custom sales dashboard using /dreambase-echarts with /dreambase-visualization-design best practices, strictly following /dreambase-data-stories so the layout reads as one clear argument about where our revenue is actually coming from
3. Data journals, stories, and infographics
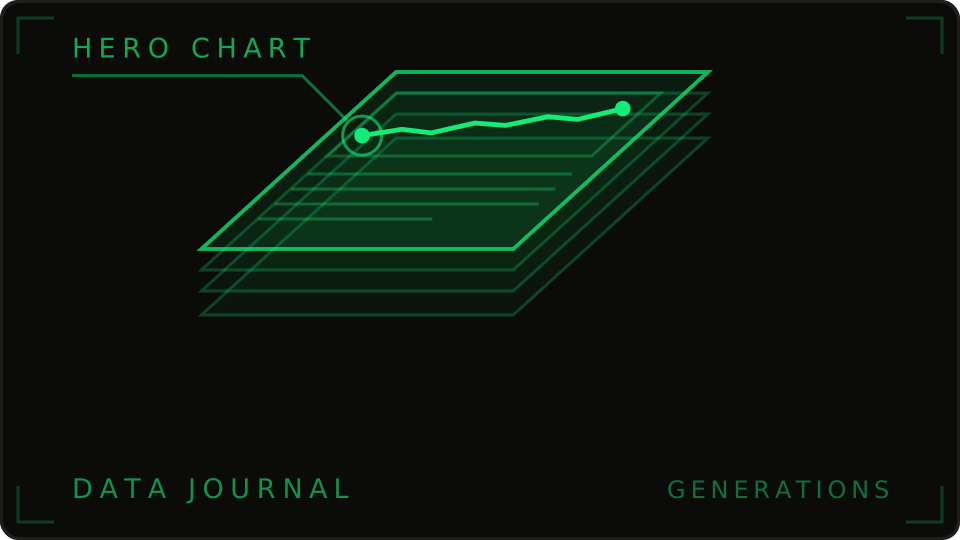
This is the combination that shows off the whole stack. Point the agent at everything in your workspace and ask for a piece of editorial, not a dashboard.
What comes back has a Big Idea, an argument that holds up when read section-heading to section-heading, a hero chart that is the argument, and annotation doing the narration. Because Dreambase spans your data sources, the agent can cross-reference product usage against billing against support volume in the same story — the connections nobody makes manually because assembling the data was the hard part.
Formats that work well: a monthly data journal, a board-meeting one-pager, an infographic for an all-hands, a scrollytelling recap of a launch, or a quarterly narrative that compares itself against the previous quarter's snapshots.
Prompt
Use @Dreambase mcp to pull our latest product KPIs across every connected data source, then create a monthly data journal strictly following /dreambase-data-stories for the narrative and hero chart, using /dreambase-visualization-design to choose every encoding and /dreambase-echarts to build the charts
4. Public reports and external artifacts
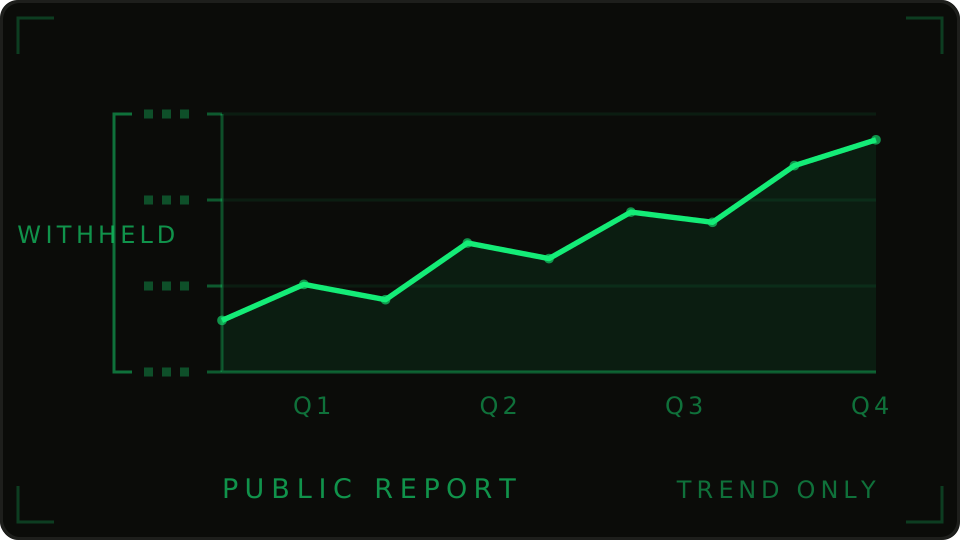
When something informed by real numbers has to leave the building, add the safety layer:
The agent analyzes the real values privately, then publishes only a transformed representation — charts that keep the true shape, direction, and turning points with no numeric axis ticks, no value labels, and no recoverable figures in the shipped source. It will ask before printing any percentage or growth rate, scoped to that exact number and placement.
Good fits: customer-facing status recaps, investor updates, marketing-site metrics, conference talks, and public benchmarks.
Prompt
Use @Dreambase mcp to pull our growth metrics, then build a public launch recap strictly following /dreambase-public-reports so no underlying values ship anywhere in the output, using /dreambase-visualization-design for encoding and /dreambase-echarts to render the transformed series, laid out with /dreambase-data-stories
5. Dreambase inside your agentic workflows
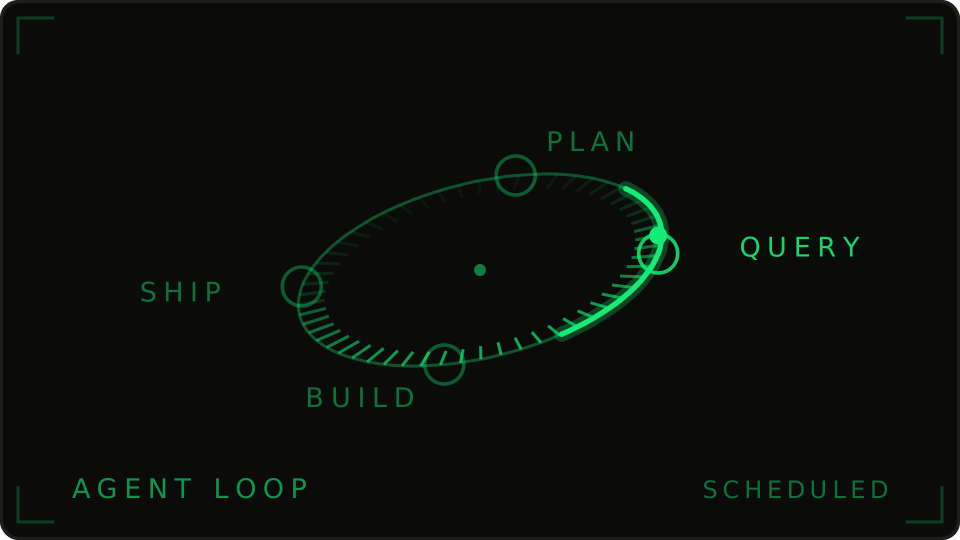
Instead of asking the agent for an artifact, give one of your own agents a standing connection to prepared data.
Here the agent is writing code, not charts — wiring the MCP tools into your own application so it reads from the scheduled datasets rather than querying production. Related patterns:
A scheduled digest. A cron-triggered agent that reads the latest aggregates and posts a written summary to Slack, only when something actually moved.
Anomaly watch. Compare the current snapshot against recent ones and raise an issue when a metric breaks its expected band.
Grounded support and sales agents. Give a customer-facing agent read access to usage datasets so its answers reflect the account in front of it.
Release gates. Have CI check the health report grade for a connected project before a migration ships.
Prompt
Use @Dreambase mcp to list our dashboards and datasets, then wire the refreshed pre-calculated datasets into our custom Data Analysis Agent so it never queries production, using /dreambase-echarts with /dreambase-visualization-design best practices so every chart it generates is correct and honest by default
6. LLM cost and observability analysis
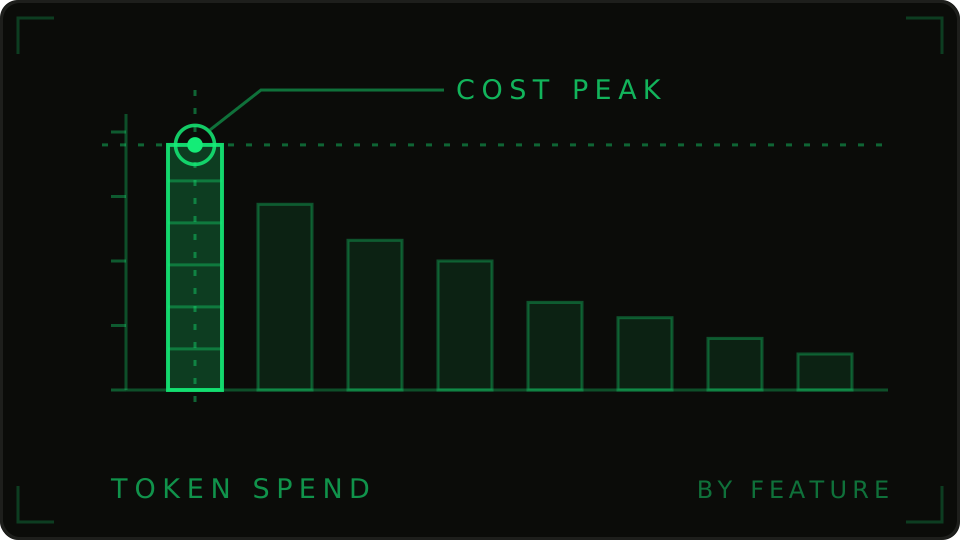
If your token spend and model telemetry land in Dreambase, the agent can analyze its own economics — and then go fix them.
This is a two-sided task: query_dataset establishes where cost concentrates by model, feature, and customer, and then the agent reads your codebase to find the call sites that explain it and the paths emitting no telemetry at all. Extend it with a cost-per-feature dashboard, a prompt-caching opportunity analysis, or a per-customer margin view.
Prompt
Use @Dreambase mcp to query our llm provider token cost datasets, then inspect our application for observability gaps and build a cost breakdown using /dreambase-echarts with /dreambase-visualization-design best practices, strictly following /dreambase-data-stories to tell the story of where our spend actually goes
7. Investigations that cross datasets
The everyday one. query_dataset runs against a single dataset at a time, but an agent can query several and reason across the results:
@Dreambase which customer segments grew fastest last quarter, and did their support volume grow with them?
Two datasets, two aggregations, one answer — and follow-up questions that stay cheap because each round trip returns a summary rather than a table.
—
Getting good results
Say which workspace if you belong to several. Every tool is workspace-scoped, and naming it saves a discovery round trip.
Ask for the aggregate before the dataset. "How did signups trend this week" is a snapshot question, not a SQL question. Reserve
query_datasetfor things the pre-computed metrics don't cover.Name the skills you want. Agents under-trigger on skills. Typing
/dreambase-public-reportsis the difference between a safe artifact and an awkward conversation.Set read-only tools to always allow, and write tools to needs-approval. Most of this catalog is read-only; only health report generation writes anything.
State the audience and the decision. "For the board, to decide next quarter's headcount" produces a materially different artifact than "for the team."
Let the agent tell you what's there. Opening with "what datasets and dashboards do I have" is often the fastest way to find the question worth asking.
The Dreambase MCP server gives any AI agent live, authenticated access to your workspace — dashboards, prepared datasets, metric snapshots, and Supabase health reports. On its own that's a data pipe. Combined with the Dreambase Skills and whatever else your agent can reach, it becomes a way to go from your warehouse to a finished artifact in a single prompt.
Dreambase MCP tools
Every tool is scoped to a workspace, so list_workspaces is usually the first call an agent makes.
Discovery —
list_workspaces,whoami,list_dashboards.Datasets —
list_datasetsandget_datasetreturn handles: name, full column schema, row count, owning dashboard.query_datasetruns one read-only DuckDBSELECTover a single dataset, which is queryable as the tabledataset.Aggregates —
list_aggregatesandget_aggregatereturn metric snapshots: daily-resolution values per metric, week-over-week change with direction and magnitude, and the narrative insight attached to each. This is the fast path for KPIs.Supabase health —
create_health_reportkicks off an analysis of a connected Supabase project;get_health_reportpolls for it and returns metrics, scores, a grade, insights, and recommendations.list_health_reportsgives you the history.
Dreambase Skills
/dreambase-visualization-design decides each chart. /dreambase-echarts builds and validates it. /dreambase-data-stories shapes the artifact around it. /dreambase-public-reports makes it safe to publish. /dreambase-industrial-schematics handles technical illustration.
Everything else your agent can reach
The MCP is one connector among many. The combinations get interesting when Dreambase data meets your codebase, your Supabase project, your Slack, your Linear, or your design tools in the same session.
Why this saves tokens
Worth stating plainly, because it changes what's practical.
The usual agentic analytics loop is expensive: connect to a database, introspect the schema, write exploratory queries, page through raw rows, and re-derive the same aggregates on every single run. You pay for all of it in context, every time.
Use cases
1. Supabase health reports on demand
Ask for a health report in plain language and get a graded assessment of a connected Supabase project back — schema, indexes, security posture, performance signals, and specific recommendations.
The agent starts the report, polls until it completes, and summarizes what matters. Where it gets genuinely useful is the follow-up, because the agent can act on what it found:
Add
/dreambase-data-storiesto turn a raw report into a reviewable one-pager for your team.Pair it with a Supabase or GitHub connector and ask the agent to open a migration for the missing indexes it identified.
Run it against every connected project and ask for a comparison — which environment is drifting, and in what direction.
Track grades over time with
list_health_reports, and chart the trend with/dreambase-echarts.
Prompt
Use @Dreambase mcp and create a Supabase health report using /dreambase-echarts with /dreambase-visualization-design best practices strictly following /dreambase-data-stories to create an infographic to tell the story of our database health
2. Custom sales and revenue dashboards
Your sales data usually lives in several places at once — Postgres, Stripe, HubSpot, Salesforce. Dreambase has already unified and prepared it, so the agent starts from joined data rather than assembling it live.
The agent lists the relevant datasets, inspects their schemas, aggregates in SQL, then builds validated chart configs. Bring in /dreambase-visualization-design and it will argue with you about the encoding first — pipeline stages become a funnel, cohort retention becomes small multiples rather than a dozen overlapping lines, and a target gets a bullet graph instead of a lonely traffic light.
Variations worth trying: a weekly pipeline review that regenerates itself, a rep leaderboard with honest sorting and denominators, a segment-level ARR breakdown, or forecast-versus-actual with the uncertainty actually drawn in.
Prompt
Use @Dreambase mcp to pull our sales datasets and pre-calculated aggregates, then build a custom sales dashboard using /dreambase-echarts with /dreambase-visualization-design best practices, strictly following /dreambase-data-stories so the layout reads as one clear argument about where our revenue is actually coming from
3. Data journals, stories, and infographics
This is the combination that shows off the whole stack. Point the agent at everything in your workspace and ask for a piece of editorial, not a dashboard.
What comes back has a Big Idea, an argument that holds up when read section-heading to section-heading, a hero chart that is the argument, and annotation doing the narration. Because Dreambase spans your data sources, the agent can cross-reference product usage against billing against support volume in the same story — the connections nobody makes manually because assembling the data was the hard part.
Formats that work well: a monthly data journal, a board-meeting one-pager, an infographic for an all-hands, a scrollytelling recap of a launch, or a quarterly narrative that compares itself against the previous quarter's snapshots.
Prompt
Use @Dreambase mcp to pull our latest product KPIs across every connected data source, then create a monthly data journal strictly following /dreambase-data-stories for the narrative and hero chart, using /dreambase-visualization-design to choose every encoding and /dreambase-echarts to build the charts
4. Public reports and external artifacts
When something informed by real numbers has to leave the building, add the safety layer:
The agent analyzes the real values privately, then publishes only a transformed representation — charts that keep the true shape, direction, and turning points with no numeric axis ticks, no value labels, and no recoverable figures in the shipped source. It will ask before printing any percentage or growth rate, scoped to that exact number and placement.
Good fits: customer-facing status recaps, investor updates, marketing-site metrics, conference talks, and public benchmarks.
Prompt
Use @Dreambase mcp to pull our growth metrics, then build a public launch recap strictly following /dreambase-public-reports so no underlying values ship anywhere in the output, using /dreambase-visualization-design for encoding and /dreambase-echarts to render the transformed series, laid out with /dreambase-data-stories
5. Dreambase inside your agentic workflows
Instead of asking the agent for an artifact, give one of your own agents a standing connection to prepared data.
Here the agent is writing code, not charts — wiring the MCP tools into your own application so it reads from the scheduled datasets rather than querying production. Related patterns:
A scheduled digest. A cron-triggered agent that reads the latest aggregates and posts a written summary to Slack, only when something actually moved.
Anomaly watch. Compare the current snapshot against recent ones and raise an issue when a metric breaks its expected band.
Grounded support and sales agents. Give a customer-facing agent read access to usage datasets so its answers reflect the account in front of it.
Release gates. Have CI check the health report grade for a connected project before a migration ships.
Prompt
Use @Dreambase mcp to list our dashboards and datasets, then wire the refreshed pre-calculated datasets into our custom Data Analysis Agent so it never queries production, using /dreambase-echarts with /dreambase-visualization-design best practices so every chart it generates is correct and honest by default
6. LLM cost and observability analysis
If your token spend and model telemetry land in Dreambase, the agent can analyze its own economics — and then go fix them.
This is a two-sided task: query_dataset establishes where cost concentrates by model, feature, and customer, and then the agent reads your codebase to find the call sites that explain it and the paths emitting no telemetry at all. Extend it with a cost-per-feature dashboard, a prompt-caching opportunity analysis, or a per-customer margin view.
Prompt
Use @Dreambase mcp to query our llm provider token cost datasets, then inspect our application for observability gaps and build a cost breakdown using /dreambase-echarts with /dreambase-visualization-design best practices, strictly following /dreambase-data-stories to tell the story of where our spend actually goes
7. Investigations that cross datasets
The everyday one. query_dataset runs against a single dataset at a time, but an agent can query several and reason across the results:
@Dreambase which customer segments grew fastest last quarter, and did their support volume grow with them?
Two datasets, two aggregations, one answer — and follow-up questions that stay cheap because each round trip returns a summary rather than a table.
—
Getting good results
Say which workspace if you belong to several. Every tool is workspace-scoped, and naming it saves a discovery round trip.
Ask for the aggregate before the dataset. "How did signups trend this week" is a snapshot question, not a SQL question. Reserve
query_datasetfor things the pre-computed metrics don't cover.Name the skills you want. Agents under-trigger on skills. Typing
/dreambase-public-reportsis the difference between a safe artifact and an awkward conversation.Set read-only tools to always allow, and write tools to needs-approval. Most of this catalog is read-only; only health report generation writes anything.
State the audience and the decision. "For the board, to decide next quarter's headcount" produces a materially different artifact than "for the team."
Let the agent tell you what's there. Opening with "what datasets and dashboards do I have" is often the fastest way to find the question worth asking.