
Kyle Ledbetter
Product
5
min read

More analytical freedom for the Data Analyst
Data Analyst Loops give Dreambase’s Data Analyst more control over the complete analytical process, from constructing the underlying dataset to determining the query, calculation, visualization, and presentation behind every chart, metric, table, and list.
Under the Data Analyst’s direction, a specialized Data Engineer agent creates a standalone, dashboard-agnostic dataset designed to support many questions, KPIs, metrics, visualizations, and downstream workflows. The Data Analyst then works on top of that analytical foundation to produce the requested dashboard or analysis.
Every component uses AI-authored DuckDB SQL against these datasets. DuckDB serves as the analytical transformation engine for metric formulas, KPI calculations, aggregations, filtering, and data shaping.
Data quality & dashboard design QA
That additional freedom is supported by Data Analyst Loops, built-in cycles where Dreambase creates an analytical data product, renders the resulting dashboard, reviews the finished output, and refines anything that needs improvement before the user sees it.
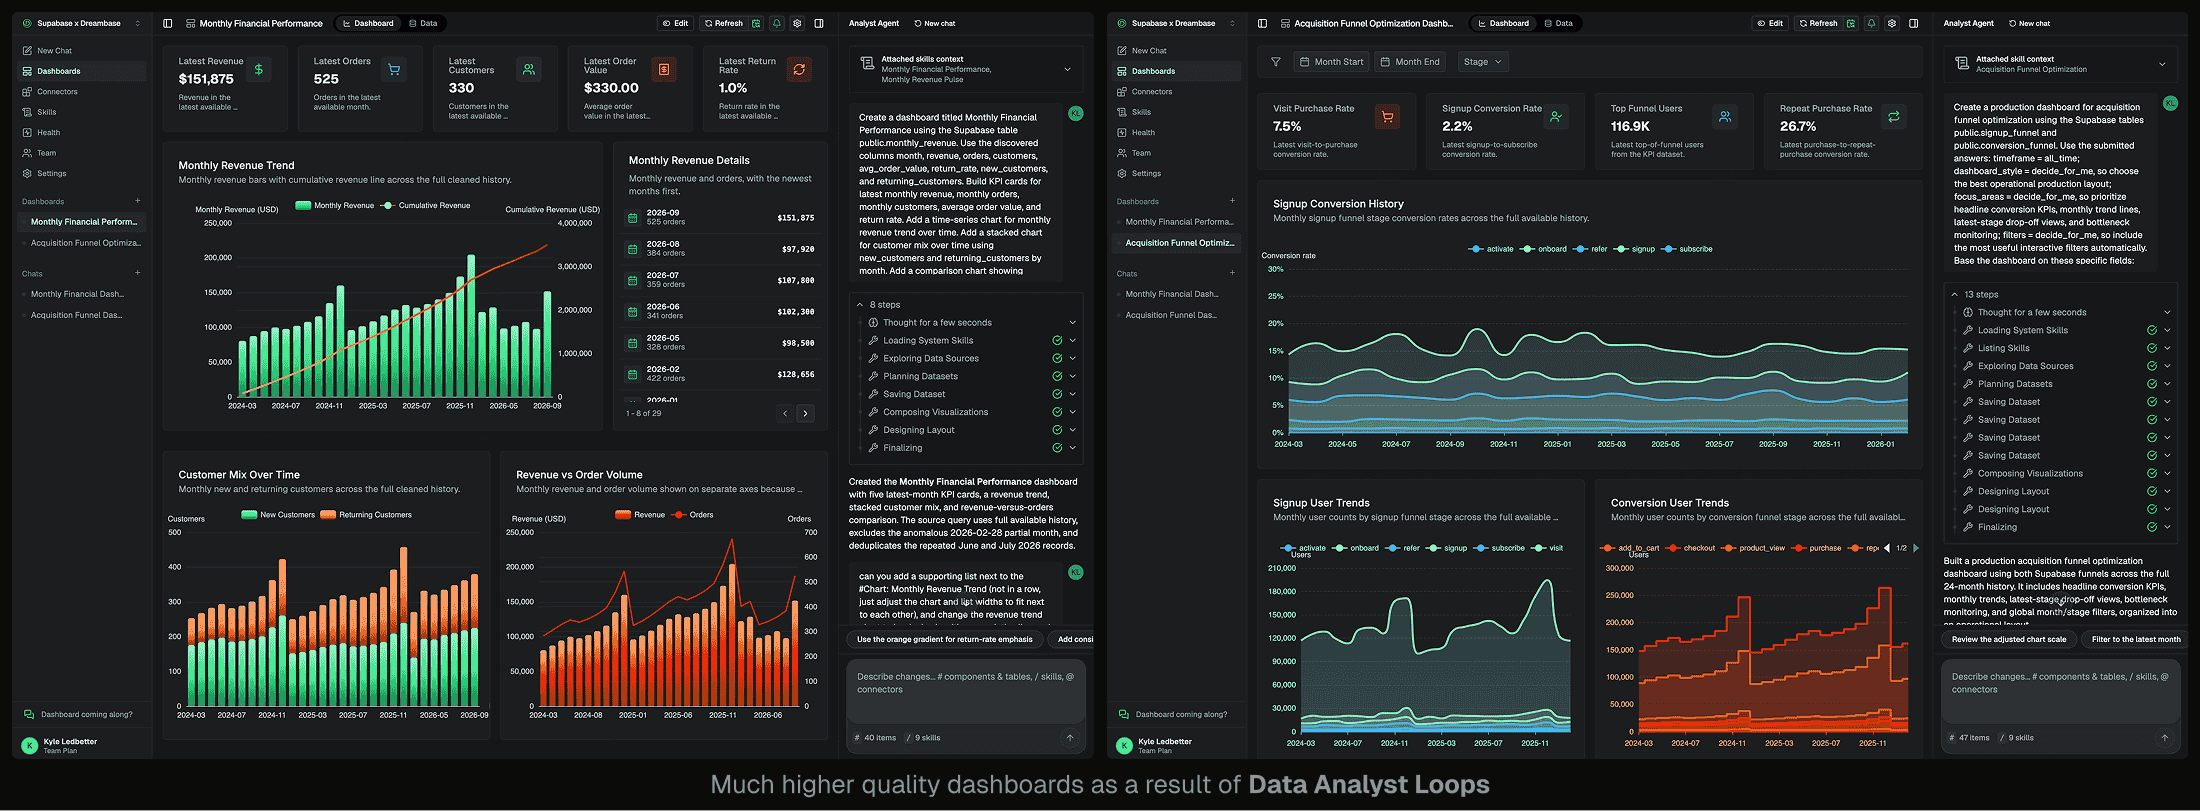
Each loop runs through the Analyst Review Graph, the multi-agent architecture coordinating the Data Analyst, Data Engineer, composer, and quality agents. The graph uses Analyst Vision, Dreambase’s server-side rendering and image-capture system, to let those agents inspect the actual charts and components exactly as the user will see them. Every result retains its Analytical Lineage, the complete path of datasets, definitions, transformations, queries, context, and results behind the finished analysis.
A powerful analytical loop
Explore Schema → Plan Datasets → Design Visualizations → Review Dashboard → Refine → Publish
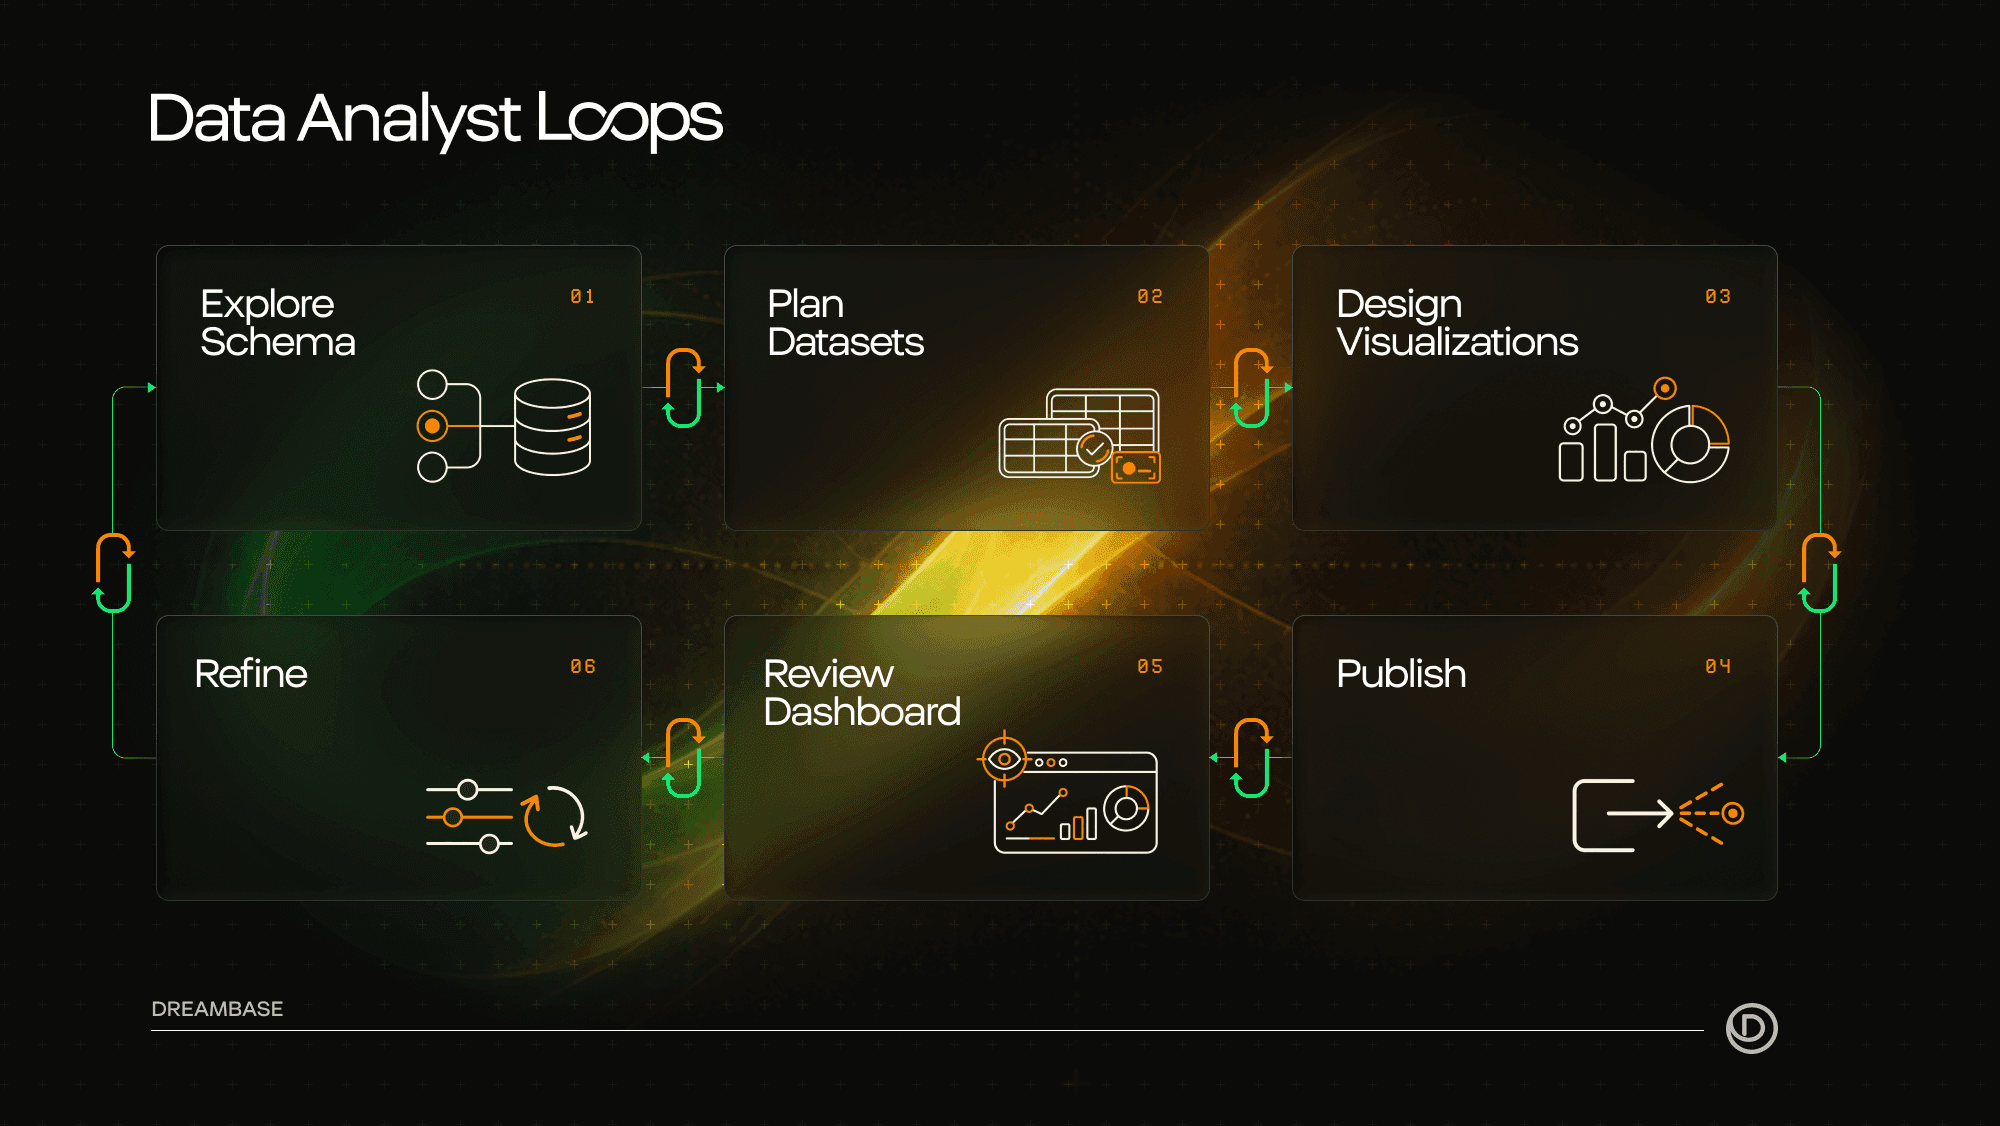
If a calculation needs adjustment, a query produces the wrong analytical shape, a chart is difficult to read, a label is truncated, or a visualization does not communicate the data effectively, the Data Analyst can revise its work and run the loop again.
Useful beyond the dashboard
Because these datasets are built as standalone analytical products, a single dataset can support multiple dashboards, reports, questions, metrics, and visualizations. It can also give agents in Claude, Codex, ChatGPT, Cursor, and other environments prepared KPIs, historical analysis, and cross-source business context without requiring a dashboard, otherwise known as "headless analytics".
A better analytical foundation
The result is better dashboards and charts, fewer analytical and visual errors, native KPI and metric computation, and reusable analytical data products for Dreambase, your team, and every agent working across your business.
Related guide: How to Make an Agent Into a Data Analyst With MCP
What do you want to know from your data?
Get the answer now.