Ed Morales
Development
6
min read
How Data Analyst Loops turn intent into validated dashboards
Dreambase's Data Analyst can build an analytical data product, execute it, render it, inspect the result, and revise its work before a user sees the dashboard. This is not one model generating a block of dashboard JSON. A durable orchestrator coordinates specialist agents. Those agents work in bounded tool loops with explicit validation, recovery, and commit conditions. Every data-bearing visual component carries an AI-authored DuckDB query, and the normal acceptance path executes that query against the real stored Parquet before commit. Building Data Analyst Loops required changing the central abstraction in our analytics architecture: a dataset could no longer be the precomputed answer for one chart. It had to become reusable material from which many answers could be computed.
The browser was doing part of the analysis
Our earlier dashboard pipeline worked, but its analytical contract was spread across too many layers. If a dashboard needed a “top 10 products” chart, the dataset planner would often produce a top-10 source query. The stored rows would then travel to the browser, where component code could perform more filtering, aggregation, sorting, and truncation before rendering the chart. This created a subtle ownership problem. Was the source query the analysis? Was the stored dataset the analysis? Or was the browser transform the analysis? Usually, the answer was all three. That made the system difficult to verify. A component could pass its configuration schema without producing a meaningful result. The legacy time-axis path could truncate dates and default a missing aggregation to count, turning one numeric observation per day into a line of ones. It also limited follow-up analysis. A top-10 dataset could not answer “show the bottom 10,” “compare the long tail,” or “split this by region” without returning to the original source and rebuilding the dataset. The issue was not that the model needed a better chart schema. The boundary itself was wrong.
Moving the analytical boundary
We split dataset creation from visualization authoring:
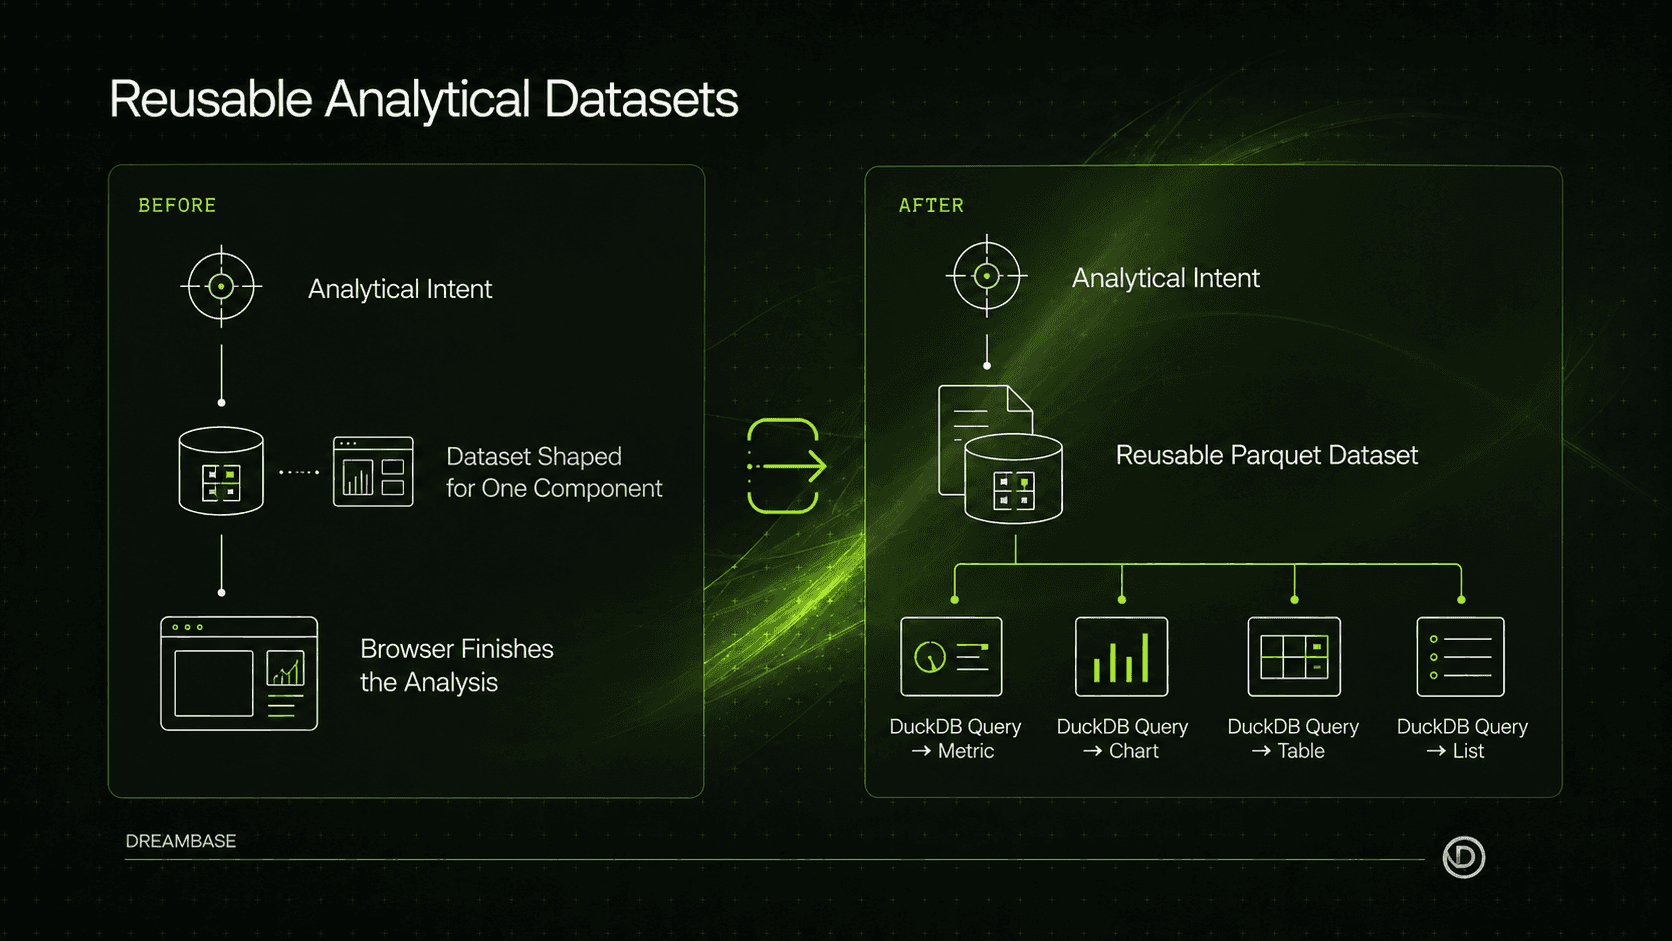
The dataset planner now plans for general analytical intent. It preserves the finest useful grain, the widest honest set of measures and dimensions, the columns needed for likely filters, and the relationships needed for downstream analysis. The result is still bounded. A dataset has a source, population, time range, security context, and declared grain. It is not a miniature data lake. But it is no longer pre-sliced around a single card. One rule captures the change:
A dataset is not the answer to a question. It is the material answers are taken from. Dataset plans therefore reject an outer
LIMIT. ALIMIT 10on the materialized dataset does not merely reduce storage: it freezes a ranking decision, skews the dataset's profiles, and removes future analytical choices. Ranking belongs in the component query that needs it. Every data-bearing component now owns two things:
a
dataset_querythat returns exactly the rows it will render;a presentation specification that turns those rows into a component. A chart and metric can independently query the same dataset:
The metric contract requires exactly one row and one column named value. Tables and lists return their already filtered and ordered rows. Presentation configuration handles labels, formatting, icons, and visual encodings—it no longer hides a second analytical engine in the browser.
DuckDB closes the loop
The new component contract is useful because it is executable. DuckDB runs in the same process as our application and can query Parquet directly. We do not need a separate analytical query service for validation, and we do not need to translate proposed component logic into a different execution environment. DuckDB performs three jobs in the pipeline:
Materialization. Source results are transformed and stored as Zstandard-compressed Parquet.
Verification. Proposed component queries run against the actual stored artifact before their components are committed.
Serving. The same execution layer resolves component rows at dashboard runtime.
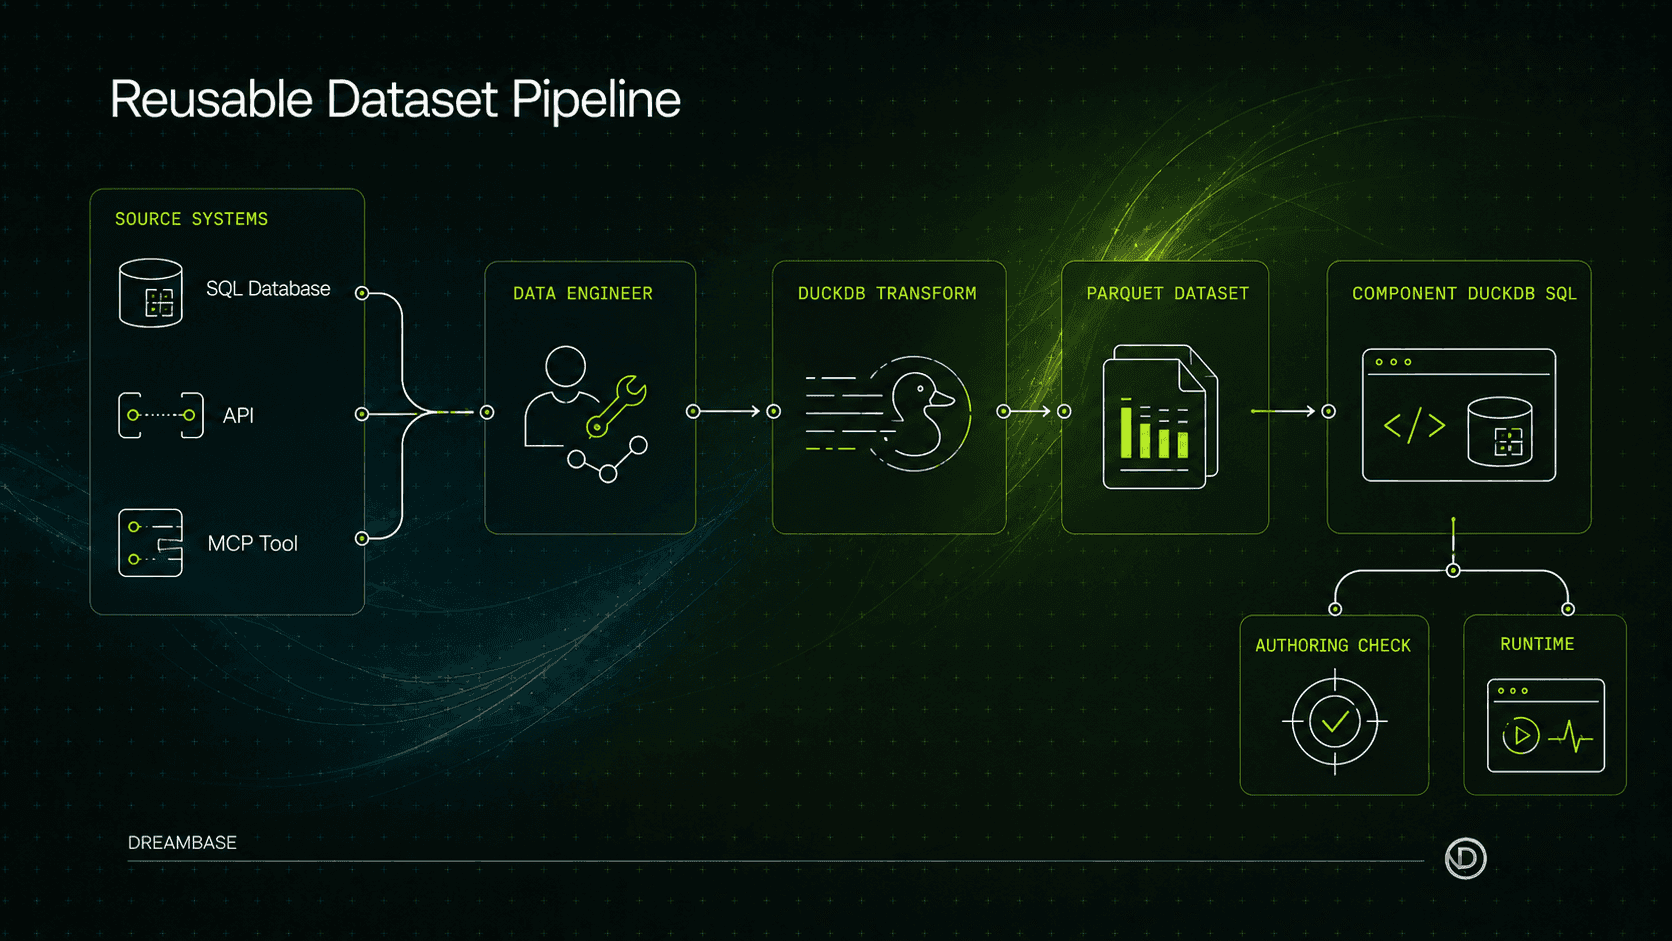
Materializing the source is deliberate. Dreambase connects to databases, APIs, and MCP tools with different query languages, latency, pagination, rate limits, and availability. Once the data is stored, downstream specialists see the same DuckDB relation regardless of where the rows originated. This gives us a stable refresh boundary. Profiles can be cached once, multiple components can reuse one artifact, and validation executes against the exact bytes production will query. The tradeoff is explicit dataset staleness rather than implicit source variability—and staleness becomes a state the orchestration graph knows how to handle.
The Data Analyst Review Graph
The name “Data Analyst Loops” is literal. The system is an execution graph with specialized nodes, conditional edges, bounded fan-out, and explicit terminal conditions.
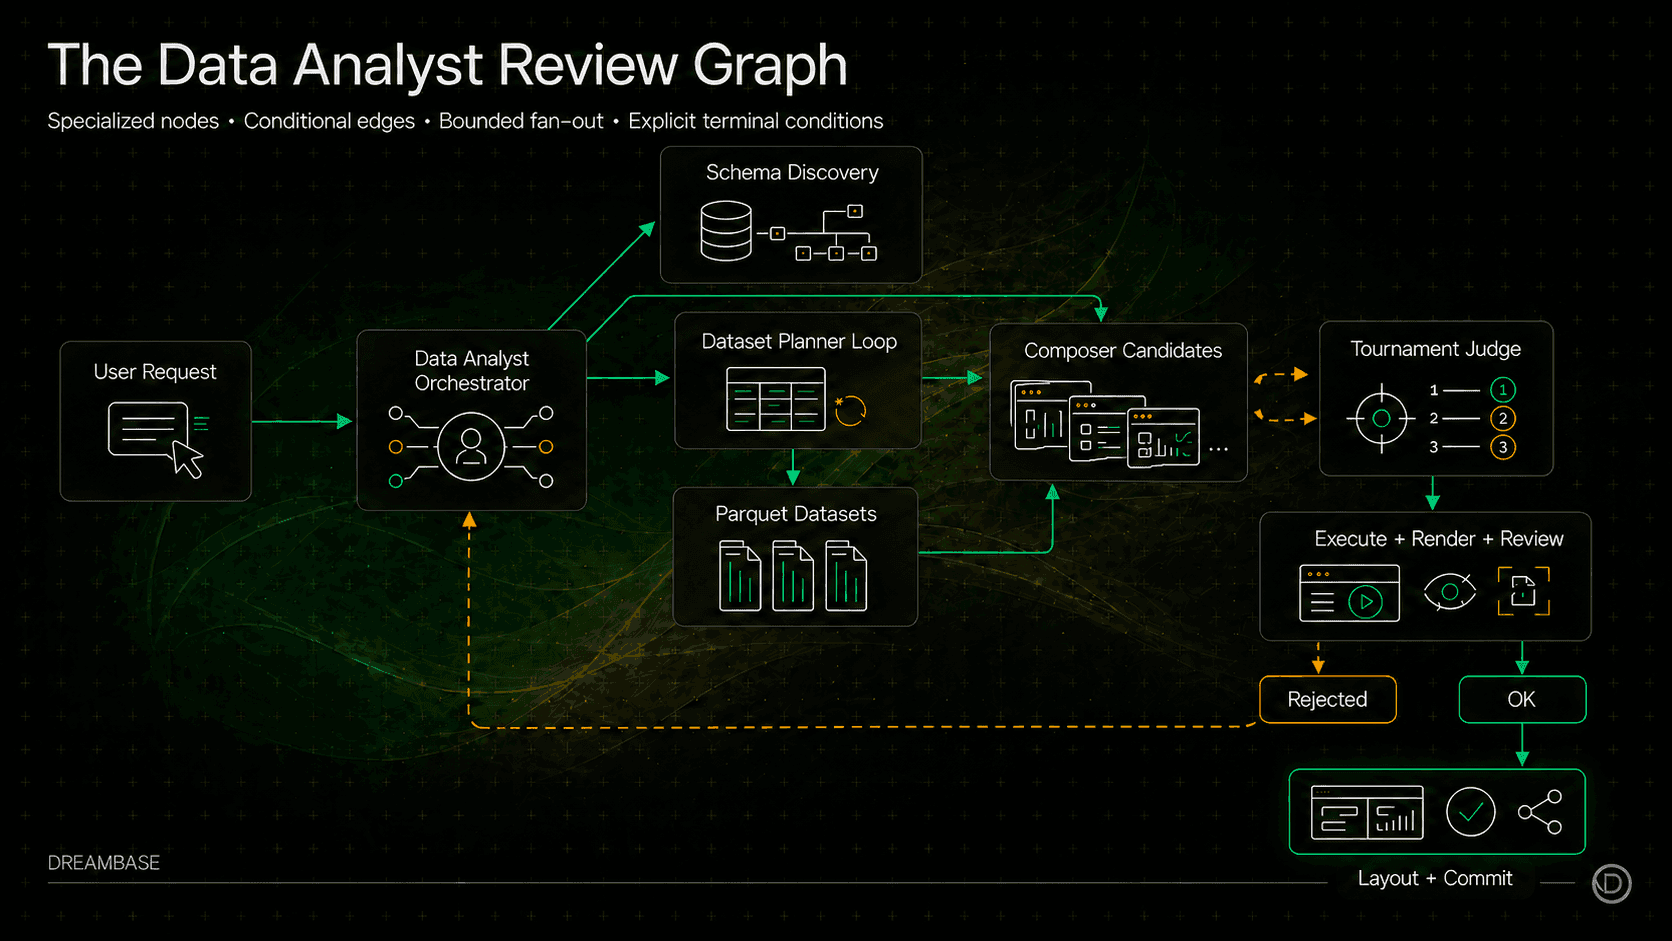
The outer Data Analyst runs as a durable workflow for each user submission. It examines the existing dashboard and selects only the path the request needs. A new dashboard may require schema discovery, dataset planning, materialization, component composition, and layout. A visual edit can go directly to composition. A stale dataset can be refreshed without replanning it. A layout-only request skips the data path. Specialists run their own tool loops inside this workflow. The dataset planner starts from discovered schema, column profiles, and targeted probes. It submits the complete dataset plan as a batch. Code-side checks validate source capabilities, referenced schema, query shape, cross-dataset filter compatibility, and the no-outer-LIMIT rule. Adversarial reviewers separately try to refute intent coverage, semantic column choice, joins, aggregation, and grain. The visualization composer inspects the stored datasets, queries sample data, and authors component operations. Multiple composer candidates can run with different directives. A separate pairwise judge chooses the strongest valid candidate, which still has to pass the outer persistence checks. Most importantly, finalize is a pre-commit gate—not a model declaring that it feels finished. A failed finalization returns success: false with structured reasons and leaves the specialist inside its tool loop. Only a committed finalization satisfies the stop condition. Step and time limits keep non-converging loops bounded. The graph's feedback edges carry specific meanings:
This is what we mean by graph engineering. Reliability comes from defining what evidence moves work forward, where control returns after failure, and which state is allowed to persist—not from asking a model to “try again” in a prompt.
One component through the loop
Return to the request for a top-products chart. The Data Analyst first asks the dataset planner for the analytical material the dashboard needs. Instead of storing only ten products, the planner preserves a useful grain with product_name, ordered_at, region, and net_revenue. The Data Engineer executes the source-specific plan, and DuckDB materializes the result as Parquet. The visualization composer can then run the top-products query shown earlier without limiting what the dataset can answer later. Assume the first chart specification binds its value encoding to amount even though the query returns revenue. The configuration is structurally valid, but our binding validator compares it with the query's actual output columns and rejects the component. Finalization returns the missing-field reason, and the composer repairs the binding inside the same tool loop. The repaired query and chart specification execute again. This time the renderer produces geometry, but the rendered card shows that long product labels collide at its real dashboard width. The visual critic rejects the result for readability. The composer revises the label presentation, renders the card again, and only then reaches a finalize call that commits the component. Neither failure becomes dashboard state. The same specialist that authored the component receives the evidence and continues working with it in context.
Valid configuration is not valid analysis
The example combines two different classes of failure. In practice, we validate each AI-authored component from the cheapest and most deterministic checks to the most expensive and perceptual:
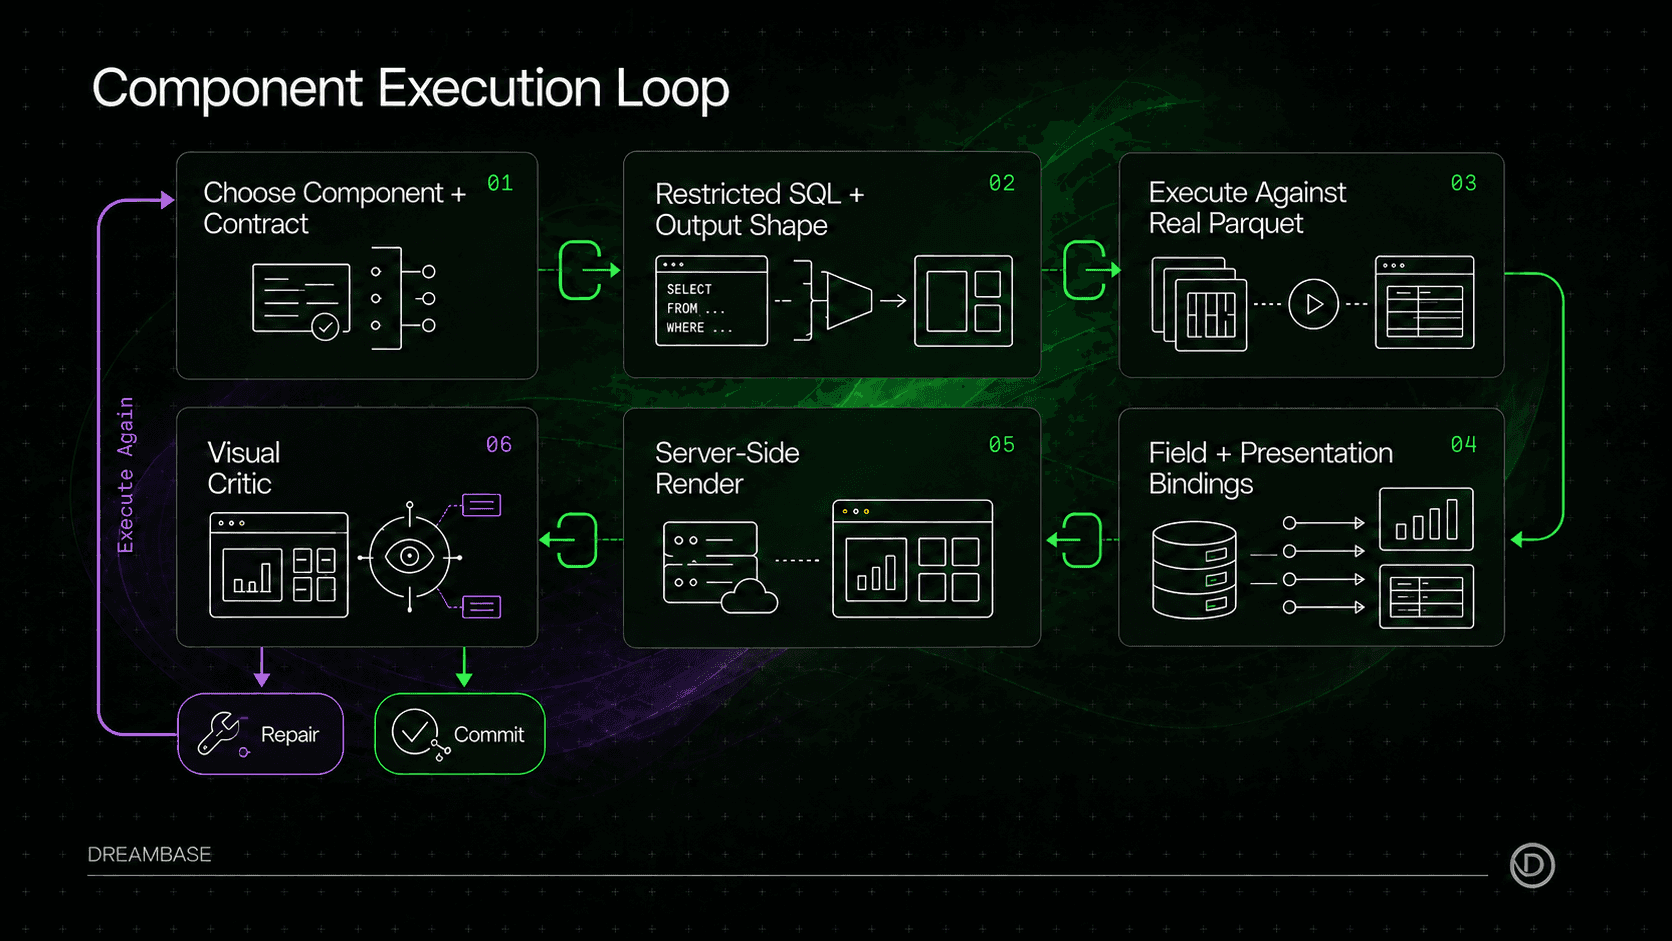
Cheap failures stop the ladder early. A metric whose query can return multiple rows does not need to be rendered. A table binding an absent alias does not need a visual critic. Deterministic validation failures always block the commit. Resource failures are classified separately. A query that exceeds its execution deadline or memory limit is not necessarily incorrect, so the model should not rewrite valid SQL in response to unavailable infrastructure. The engine fails loudly rather than silently truncating rows and changing the analytical answer. Each component type then applies its own contract:
Component | Executable contract | Deterministic verification | Render review |
|---|---|---|---|
Chart | Query returns the rows described by the chart specification | Output bindings, series semantics, and drawable geometry | Composition, readability, and faithfulness |
Metric | Query returns exactly one row and one column named | Query shape and returned scalar | Value presentation and card coherence |
Table | Query returns the final ordered rows | Every configured column exists in the output | Cell formatting and table legibility |
List | Query returns the final ranked or grouped rows | Every field mapping exists in the output | Field coherence and card legibility |
Production follows the reviewed path
Validation is weak when production uses a different execution model. Dashboard runtime now follows the same component contract used during composition. For each dataset needed by a dashboard, the server opens one restricted DuckDB session. Active dashboard filters are compiled into the logical dataset relation, and component queries execute against that filtered view:
The browser receives only the rows each component renders. It does not download the complete compressed dataset and repeat analytical transforms locally. Active filters are already part of the dataset view, so every component executes against the same filtered relation. Filter options resolve server-side over Parquet as well, avoiding cases where the browser loaded 50,000 rows merely to discover four order statuses. Together, component queries and server-resolved filter options remove dashboard rendering's dependency on the full-dataset endpoint. We migrated components in stages while keeping one target contract. Legacy charts were deterministically transpiled into native chart specifications plus dataset_query; metrics, tables, and lists followed with contract-specific transpilers. Compatibility code helped existing state cross the boundary, but it did not remain as a second permanent rendering architecture.
What we learned
Separate analytical intent from display intent. A dataset designed around a single card is easy to render once and difficult to reason about later. Preserving a useful grain and analytical surface gives every downstream component more freedom. SQL becomes a contract only when it is executed. Allowing AI-authored SQL increased expressiveness. DuckDB made that freedom governable because the system can run the query against the real artifact during authoring and again at runtime. Agent reliability comes from control flow. Specialist roles help, but the important mechanisms are typed outcomes, bounded recovery edges, and commit conditions that code—not the model—enforces.
Validate as close to the final output as possible. Schemas catch malformed configuration. Query execution catches incorrect assumptions about data. Rendering catches the failures that exist only when valid configuration becomes pixels. Data Analyst Loops do not make model output infallible. They make it inspectable, rejectable, and repairable. Instead of asking an AI to describe the dashboard it intends to build, we give it an environment where it can build the analysis, execute it, see the result, and keep working until the evidence is good enough to commit.
Check it out, it's live today! (or see the release details here)
Related guide: How to Make an Agent Into a Data Analyst With MCP
What do you want to know from your data?
Get the answer now.